
The State of Clean Energy – 2021
HOW DOES YOUR STATE STACK UP IN THE CLEAN ENERGY ECONOMY?
NOTE: Archived figures from 2021 can be found below. Click here to view the most recent State of Clean Energy data and access current state infographics.
Clean energy industries represented the growth sectors of the U.S. energy economy over the past decade, providing good-paying jobs while supporting a cleaner, healthier future for communities across the nation. CEBN and the Business Council for Sustainable Energy are pleased to launch this interactive suite of infographics documenting the clean energy economies across all 50 states and the District of Columbia. This data provides a snapshot of clean energy deployment, jobs, CO2 emissions, energy efficiency, and local impacts of federal investments in energy R&D. Click on each state below to access an infographic.
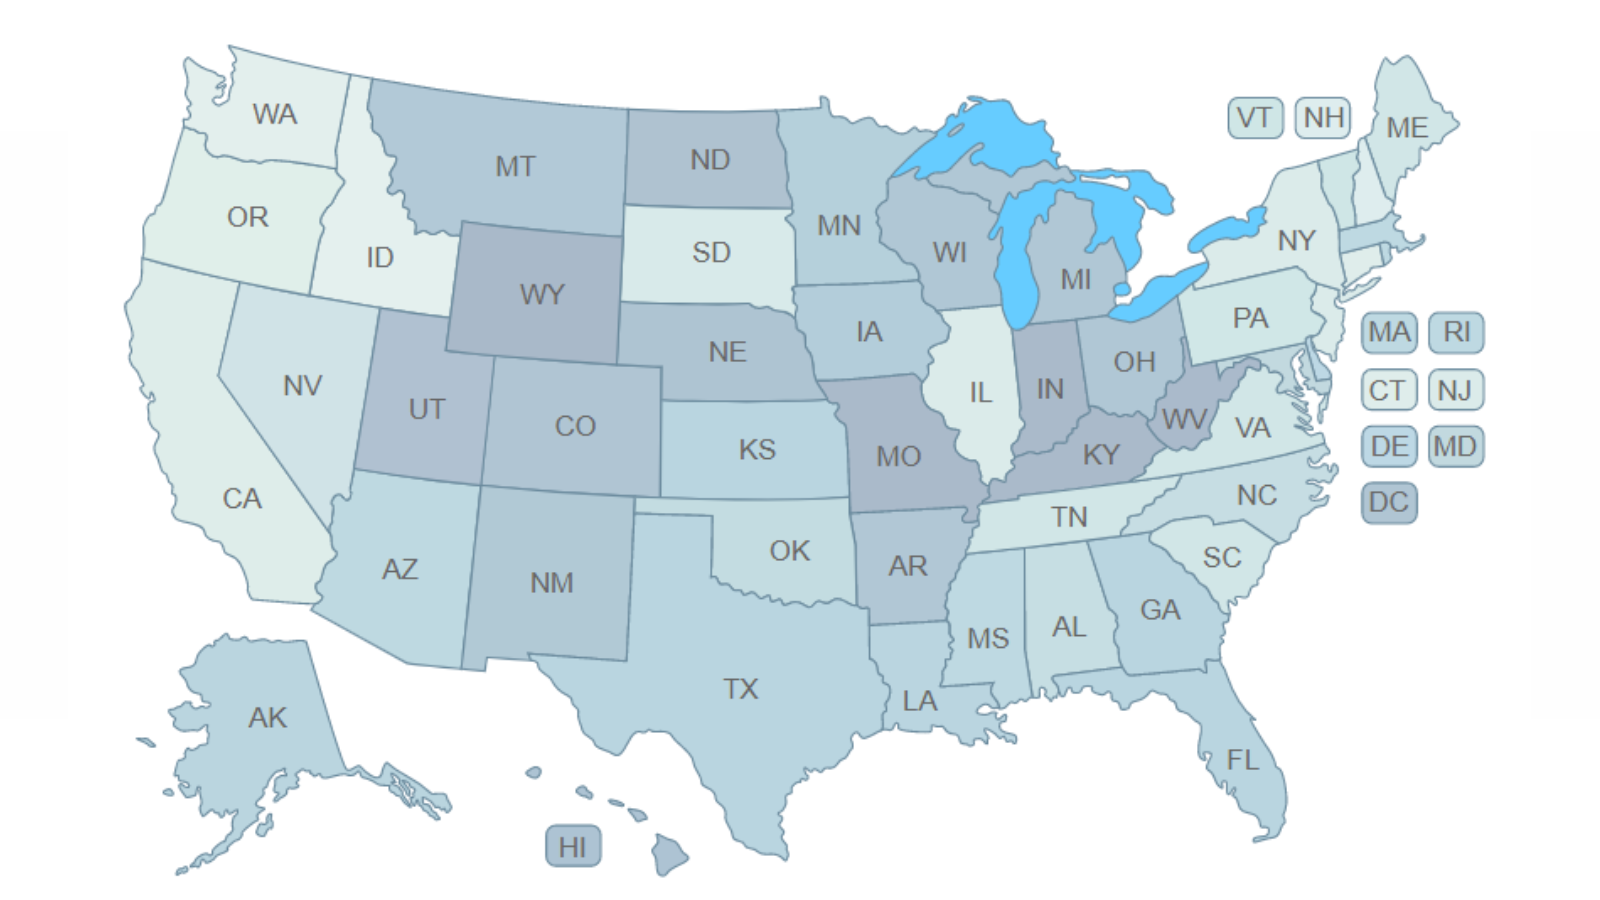
The map below depicts state CO2 emissions rates for the electricity sector. To view the 2021 infographics, visit the current State of Clean Energy page and click on the desired state to see a list of previous years’ infographics.

Find out which states are leaders in clean energy by checking out our top ten lists.
On a nationwide scale, the 2021 Sustainable Energy in America Factbook, produced by Bloomberg New Energy Finance and the Business Council for Sustainable Energy, documents the macro-level trends in the transformation of the U.S. energy economy.
-
-
- In 2010, nearly half of U.S. electricity came from coal. Today, that’s down to roughly 19%, replaced by zero/low-carbon technologies such as renewables and natural gas.
- Despite the COVID-19 pandemic, the U.S. set new records for clean energy. Wind generation increased 12% from 2019 to 2020, hydropower grew to account for 35% of total renewable output, and more solar capacity was added in 2020 than any previous year.
- In fact, over the past decade, natural gas and renewables have made up 95% of new build.
- Over 3.36 million Americans are working in clean energy, and wind and solar were among the fastest-growing occupations in America.
-
#
Data: Color shading on all infographics indicates percentile among 50 U.S. States and the District of Columbia. Clean energy industries included are energy efficiency, renewable energy, natural gas, storage, and advanced grid technologies. COVID-19 2020 job loss calculations by BW Research do not include natural gas sector and do include additional data on clean vehicles, so are not perfectly analogous with 2019 job data.
Sources: Advanced Research Projects Agency-Energy (ARPA-E), American Council for an Energy-Efficient Economy, Bipartisan Policy Center, Bloomberg New Energy Finance, Breakthrough Energy, BW Research, Energy Information Administration, USASpending.gov.
Graphic Design: Anthony Poff