
The State of Clean Energy – 2020
HOW DOES YOUR STATE STACK UP IN THE CLEAN ENERGY ECONOMY?
NOTE: Archived figures from 2020 can be found below. Click here to view the most recent State of Clean Energy data and access current state infographics.
Clean energy industries represented the growth sectors of the U.S. energy economy over the past decade, providing good-paying jobs while supporting a cleaner, healthier future for communities across the nation. In celebration of National Clean Energy Week, CEBN and the Business Council for Sustainable Energy are pleased to launch this interactive suite of infographics documenting the clean energy economies across all 50 states and the District of Columbia. These infographics give a snapshot of clean energy deployment, jobs, CO2 emissions, energy efficiency, and local impacts of federal investments in energy R&D. Click on each state below to access an infographic.
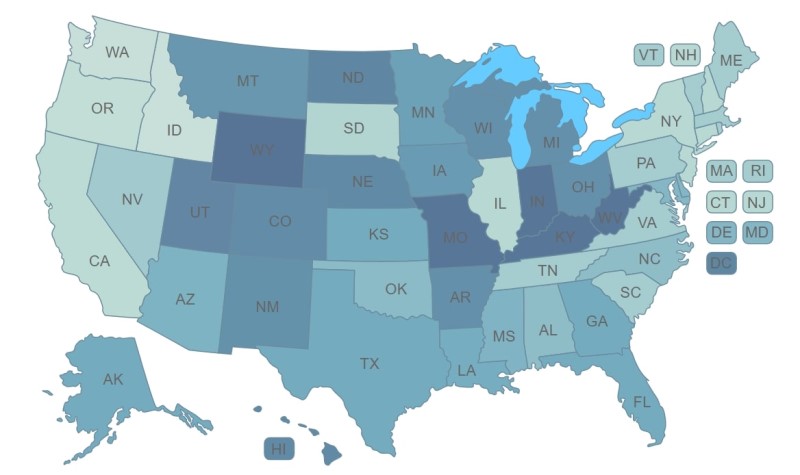
The map below depicts state CO2 emissions rates for the electricity sector. Individual state infographics can be found below the map.

Alabama
Alaska
Arizona
Arkansas
California
Colorado
Connecticut
Delaware
District of Columbia
Florida
Georgia
Hawaii
Idaho
Illinois
Indiana
Iowa
Kansas
Kentucky
Louisiana
Maine
Maryland
Massachusetts
Michigan
Minnesota
Mississippi
Missouri
Montana
Nebraska
Nevada
New Hampshire
New Jersey
New Mexico
New York
North Carolina
North Dakota
Ohio
Oklahoma
Oregon
Pennsylvania
Rhode Island
South Carolina
South Dakota
Tennessee
Texas
Utah
Vermont
Virginia
Washington
West Virginia
Wisconsin
Wyoming
On a nationwide scale, the 2020 Sustainable Energy in America Factbook, produced by Bloomberg New Energy Finance and the Business Council for Sustainable Energy, documents the macro-level trends in the transformation of the U.S. energy economy.
-
-
- In 2010, nearly half of U.S. electricity came from coal. Today, that’s down to roughly 25%, replaced by zero/low-carbon technologies such as renewables and natural gas.
- Over 3.2 million Americans worked in clean energy before the COVID-19 epidemic, and wind and solar were the fastest-growing occupations in America.
- In the past decade in the U.S., renewable energy generation grew 77%, natural gas generation grew 60%, and energy productivity grew 18% (GDP / energy consumption).
- None of these changes came at greater cost – in fact, total monthly household expenditures on energy decreased 1/3 since 2010.
-
#
Data: Color shading on all infographics indicates percentile among 50 U.S. States and the District of Columbia. Clean energy industries included are energy efficiency, renewable energy, natural gas, storage, and advanced grid technologies. COVID-19 2020 job loss calculations by BW Research do not include natural gas sector and do include additional data on clean vehicles, so are not perfectly analogous with 2019 job data.
What data are not included: At the time this project was launched, the BNEF database we used only provided state-level % generation data from renewable energy and natural gas. The database did not break out the contribution of nuclear and coal; therefore, these power sources were grouped as “other.” We plan to procure the state-level breakdowns of nuclear and coal generation in future years of this project. In the meantime, we provide aggregated nationwide data on these electricity sources at www.bcse.org/factbook and several case studies at www.cebn.org. We also were unable to break down low-emission/alternative fuel transportation technologies so have focused mainly on the power sector.
Sources: Advanced Research Projects Agency-Energy (ARPA-E), American Council for an Energy-Efficient Economy, Bipartisan Policy Center, Bloomberg New Energy Finance, Breakthrough Energy, BW Research, Energy Information Administration, USASpending.gov.
Graphic Design: Anthony Poff