
The State of Clean Energy – 2022
Total U.S. Clean Energy Jobs
Avg. State Energy Efficiency Score
National Renewable Generation (%)
National Natural Gas Generation (%)
NOTE: Archived figures from 2022 can be found below. Click here to view the most recent State of Clean Energy data and access current and past state infographics.
Clean energy industries represented the growth sectors of the U.S. energy economy over the past decade, providing good-paying jobs while supporting a cleaner, healthier future for communities across the nation. CEBN and the Business Council for Sustainable Energy are pleased to release the third annual State of Clean Energy, with interactive infographics documenting the clean energy economies across all 50 states and the District of Columbia.
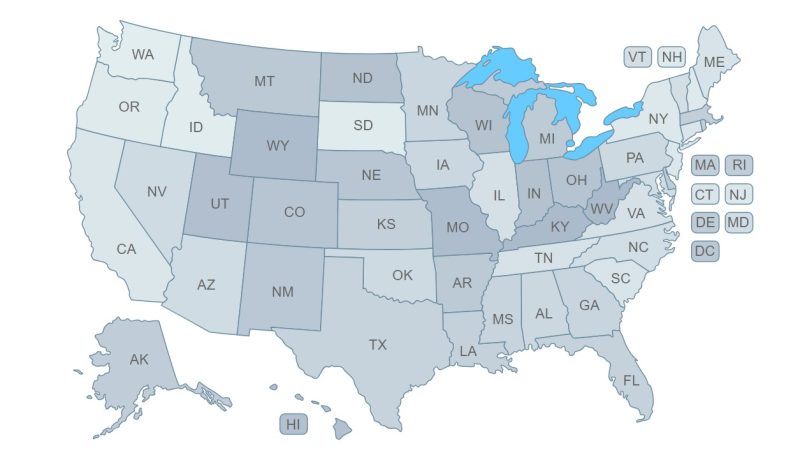
The map below depicts state CO2 emissions rates for the electricity sector. To view the 2022 infographics, visit the current State of Clean Energy page and click on the desired state to see a list of previous years’ infographics.
How does your state stack up in the clean energy economy?

____
The State of Clean Energy This Year
On a nationwide scale, the 2022 Sustainable Energy in America Factbook, produced by BloombergNEF and the Business Council for Sustainable Energy, documents the macro-level trends in the transformation of the U.S. energy economy. Here are some key takeaways on the trends in clean energy this year.
-
-
-
- In 2010, nearly half of U.S. electricity came from coal. Today, that’s down to roughly 20%, replaced by zero/low-carbon technologies such as renewables and natural gas. In 2021, renewables grew 4.1% year-on-year, rising to over 21% of total power generation. Meanwhile, almost 4.2 GW of battery storage came online in 2021 compared to 0.9 GW the year prior.
- Nearly every state saw positive job growth in 2022 from the expanding clean energy economy, coupled with recovery from job losses during the COVID-19 pandemic. States gained 1,858 jobs on average—and 94,751 in total—across clean energy sectors. Over 4 million Americans are working in clean energy, and wind and solar remain among the fastest-growing occupations in America.
- The electricity mix is getting cleaner. A record level of $105 billion in investment went into clean energy deployment, an 11% jump over 2020 and a 70% increase relative to 5 years ago. As a result, the U.S. installed 31,708 MW of new renewable energy capacity in 2021. The top states for new build were spread across the country, including Texas, California, New York, Florida, and Illinois.
- The clean energy transition is underway but still faces challenges. Emissions overall increased in 2021, despite increases in low-carbon energy deployment, as a result of increased demand following the recovery from the pandemic.
- Federal investment from the Department of Energy programs such as SBIR, ARPA-E, and EERE supported energy innovation in every state while supporting the U.S.’s Paris Agreement target of 50-52% emissions reductions by 2030. Recent legislation such as the Bipartisan Infrastructure Law, CHIPS, and potentially the Inflation Reduction Act (IRA) will be rolled out over the next decade. Notably, various analyses suggest IRA would enable the U.S. to reduce GHGs relative to 2005 levels by roughly 40%.
-
-
Find out which states are leaders in clean energy by checking out our top ten lists.
____
The State of Clean Energy Archives
View previous years’ map and takeaways.
2021
2020
____
Data: Color shading on all infographics indicates percentile among 50 U.S. states and the District of Columbia. Clean energy industries included are energy efficiency, renewable energy, natural gas, storage, and advanced grid technologies. Total job numbers are calculated from the USEER 2022 jobs report.
Sources: Advanced Research Projects Agency-Energy (ARPA-E), American Council for an Energy-Efficient Economy, Bipartisan Policy Center, Bloomberg New Energy Finance, Breakthrough Energy, BW Research, Energy Information Administration, U.S. Energy and Employment Rreport, USASpending.gov.
Graphic Design: Anthony Poff